

Never paid taxes!
The Usurper ~ Obama.
“Banking was conceived in iniquity, and born in sin. Bankers own the earth. Take it away from them, but leave them the power to create money, and with the flick of a pen, they will create enough money to buy it back again. Take this great power away from them, and all great fortunes like mine will disappear. And, they ought to disappear, for then this would be a better and happier world to live in. But if you want to continue to be the slaves of the bankers, and pay the cost of your own slavery, then let bankers continue to create money, and control credit.”
— ABRAHAM LINCOLN
In the last decade, we experienced the growth of the greatest number and size of asset bubbles in history made possible by a bubble in instruments that Warren Buffett has labeled “financial weapons of mass destruction.” Now that this mother of all bubbles is breaking, who can afford to pick up the tab? (For definitions, please see the glossary at the end of the article.)
In 1999 Bill Clinton Repealed FDR’d Glass Steagall Act Allowing Off Shore Banks To Indebt The U.S. By Constructing empty ‘derivatives’ for mortgage lending.
It is the stuff of which legends are made. A get-together of finance geniuses in 1994 in Florida from JP Morgan (JPM), all brainstorming on ways to increase the amount of money the bank could loan. How could it find a way to free up more capital to loan and make more in fees?
The answer was simplicity itself. Create an insurance policy in which a third party (investor) would assume the loan risk in exchange for regular premiums from the bank. The bank got what it wanted – remove the loan from its books, freeing up money to make more loans. In return for helping out, the investor got paid for taking the risk in a derivative instrument called a credit default swap. It seemed like a match made in heaven.

“The money powers prey upon the nation in times of peace, and conspire against it in times of adversity. The banking powers are more despotic than a monarchy, more insolent than autocracy, more selfish than bureaucracy. They denounce as public enemies, all who question their methods or throw light upon their crimes.
I have two great enemies, the Southern Army in front of me and the bankers in the rear. Of the two, the one at my rear is my greatest foe. [As a further undesirable consequence of the war…] Corporations have been enthroned, and an era of corruption in high places will follow. The money power of the country will endeavor to prolong its reign by working upon the prejudices of the people until the wealth is aggregated in the hands of a few, and the Republic is destroyed.”
Before long, according to Newsweek, investors were being encouraged to buy into riskier emerging markets in Russia and Latin America insuring debt. In the wake of Enron and WorldCom, it became obvious that there was a need for this type of insurance and the industry was well on its way. By 2000, the CDS market had passed the $100 billion mark and by 2004 it had grown to more than $8 trillion, an 8000% increase. It was just the beginning.
The Perfect Petri Dish
When the Federal Reserve cut interest rates in 2001 and kept cutting them into 2004 in an effort to avert the fallout from the bursting of the internet bubble, it created the perfect environment for a new series of bubbles and real estate was a major beneficiary. Demand for mortgages went through the roof as hordes rushed to buy property.
Banks hobbled by capital reserve restrictions that limited them to $10 in loans for every $1 on deposit needed help in expanding their mortgage businesses and CDSs were the perfect vehicle. Wall Street had come to the aid of Main Street and terms like collateralized debt obligations (CDOs), residential mortgage-backed securities (RMBS) and commercial mortgage-backed securities (CMBSs) became new catch phrases in the lexicon of mortgage finance terminology.

Figure 1 – Credit derivative swaps are now the fastest growing segment of the derivatives market. These instruments traded in the billions in 2000. In 2007, credit derivative swaps (CDS) totaled $62.17 trillion up from $34.42 trillion in 2006.
New financial vehicles led to mortgage traunches in which thousand and in some cases millions of individual mortgages were pooled together by banks into CDOs and resold to Wall Street firms. Rating agencies like Standard & Poor’s, Fitches and Moody’s also got into the act to provide financial opinions as to the soundness of these nascent mortgage instruments which were in turn insured by CDSs to offset the risk.
But these instruments were only part of the story. Credit derivatives have been issued for everything from credit card, small business and student loan debt to aircraft loans.
Since it was nearly impossible for the investor to access the creditworthiness of a pool of a million mortgages or loans, Wall Street financial engineers thought it prudent to get a second opinion. Engaging the rating agencies was a brilliant marketing strategy. As it turns out, it was nearly impossible for rating agencies to assess the true risk of these instruments as well but I’m getting ahead of myself.

“The Government should create, issue, and circulate all the currency and credits needed to satisfy the spending power of the Government and the buying power of consumers. By the adoption of these principles, the taxpayers will be saved immense sums of interest. Money will cease to be master and become the servant of humanity.”
–PRESIDENT LINCOLN
Here is how Jim Grant of Grant’s Interest Rate Observer described the creation of subprime mortgage derivatives in a March 2007 Bloomberg interview.
“Hundreds of billions of dollars of collateralized debt obligations and the like are sold in any year – immense amounts. They take a bunch of loans and fashion an asset backed security from those loans. They take those loans and you repackage them into a collateralized debt obligation, a CDO. There can be a million individual loans in a CDO,” he explained.
“Now here is the magic and mystery of a CDO,” he continued. “They take 70% of a pile of triple-B minus (meaning marginal credit) and the rating agencies will bless it. They will say that ‘we have studied the correlations and trends and we pronounce 70% of this pile of junk to be triple-A,’ triple-A!” he exclaimed (emphasis is his not mine).
How do they do that?
“They have their models – very elaborate and no doubt mathematically literate and internally logical models that tell them that in a given environment, these loans will perform up to triple-A standard. My contention is that the last couple of years have been so anomalous from the point of view of underwriting practices [not to mention appreciation in real estate prices] that all those models are going to be wrong,” Grant said.

Figure 2 – Interest rate and currency derivatives (like Forex options contracts) are also growing rapidly and totaled $382.3 trillion in 2007. This market is a little older than the CDS market and began in 1986-7.
How prophetic these words turned out to be. It soon became painfully apparent that rating agency models were based on the assumption that since housing prices had not dropped across the nation for more than 80 years since the Great Depression, a fall in prices was outside their realm of possibilities. And that assumption turned out to be catastrophically wrong.
As we see from Figure 1, by the end of 2007, the total amount of credit default swaps outstanding exploded to $62.2 trillion in 2008 according to the International Swaps & Credit Derivatives Association (ISDA). Between 2004 and 2008, CDSs were doubling every year! But then something unprecedented happened. The volume of CDS trades dropped 12% in the first half of 2008 to $54.6 trillion according to the ISDA.
A CDS is like an insurance policy. CDS issuers are relying on the buyer to act as insurer if the underlying debt, like a collateralized debt obligation of a million mortgages bundled together, for example, goes bad. In the event that the CDS holder is unable to full his or her obligation, this responsibility falls back on the issuer. The big difference between a CDS and an insurance policy is that to issue insurance, the insurer must be hold assets in reserve in case of a claim. CDS markets on the other hand are unregulated and there are no reserve requirements.
But this difference may be moot. As we saw with Lloyd’s of London more than two decades ago, a string of unexpected claims can bankrupt this reserve as well as its backers. But there is little doubt that any reserve, no matter how big could have anticipated the scope of the credit meltdown.
While only time will tell how many banks and non-bank institutions who issued these derivatives will ultimately survive, defaults are soaring forcing many to take liabilities back on their balance sheets. What happens if they can’t pay their obligations? During the first three quarters of 2008, insurer AIG (AIG) suffered $18 billion in losses tied to guarantees it wrote on mortgage backed derivatives and we know what happened that company.
We gained further insight into the scope of the problem in the October 10 auction of roughly $400 billion in credit default swaps held by bankrupt firm Lehman Brothers. The recovery rate on the firm’s senior debt was a meager 8.625 cents on the dollar which meant that CDS sellers were responsible for 91.375 cents out of every dollar sold. Looking at the bigger picture, does that mean that $54.6 trillion in CDSs could now be worth less than $5 trillion? And since Lehman is now bankrupt, who is stuck with this bill? These are just two of many questions that remain.

Figure 3 – Prices for the composite of 15 ABX subprime mortgage off-the-run indexes tracked by Markit.com (blue) and the worst performing (BBB-minus) in red. Index values priced at 100 in January 2007 had fallen to 33 for the composite and a mere 5.4 for the BBB- index.
As we see from Figure 3, values for subprime bonds that in effect insured these mortgages have fallen through the floor, and are worth anywhere from 5 to 33 cents on the dollar today. However, unlike subprime mortgages charted by Markit.com, most derivatives are not publicly reported making it next to impossible for anyone other than the parties to these contracts to assess their real value.
It is also important to point out that CDSs are a small part of the overall picture representing just 10% of the huge over-the-counter (OTC) derivatives market that totaled $596 trillion by December 2007 (see Figure 4 below) in a market that until recently had been doubling in size every 1.88 years. That works out to roughly 40 times 2008 U.S. GDP. In 2000, this market was worth less than $100 trillion.
Are U.S. Banks the Global Achilles Heel?
An examination of U.S. banking exposure to derivative risk is a sobering experience. Data from the Office of the Comptroller of Currency (OCC) clearly lays out which banks carry the highest risk. As of the latest available figures, the top five U.S. banks held more than 97% of total U.S. bank derivative counter-party risk. In other words, they could ultimately be responsible for picking up the tab on claims that result from bad investments backed by the derivatives they issued.
As we see from Table 1, JP Morgan Chase with nearly $90 trillion in total OTC derivative counterparty risk has the most to lose from a global credit meltdown. As of first quarter 2008, it had a nominal value of more than $8 trillion in credit derivatives on its books. If the October 10 Lehman CDS auction is a relevant benchmark, this means that JP Morgan could have seen the value of these derivatives drop to less than $700 billion which means it has a potential liability of more than $7.5 trillion! Such a loss would prove catastrophic to both JP Morgan and the banking system.
Top 25 U.S. Bank Derivative Exposure
|
Q1-2008 |
TOTAL |
TOTAL |
TOTAL |
% of Top 25 |
|
($ Millions) |
DERIVATIVES |
SWAPS |
CREDIT |
Derivative |
|
(OTC) |
DERIVATIVES |
Exposure |
||
| RANK BANK NAME |
(OTC) |
|||
| 1 JPMORGAN CHASE |
$89,997,271 |
$57,540,634 |
$8,121,236 |
50.0% |
| 2 BANK OF AMERICA |
37,939,665 |
25,898,242 |
3,098,984 |
21.1% |
| 3 CITIBANK NATIONAL |
37,691,434 |
21,921,982 |
3,351,191 |
21.0% |
| 4 WACHOVIA BANK |
4,884,775 |
3,241,223 |
453,900 |
2.7% |
| 5 HSBC BANK USA |
4,279,737 |
2,090,701 |
1,341,013 |
2.4% |
| Top 5 Bank Totals |
$174,792,882 |
$110,692,782 |
$16,366,324 |
97.2% |
| 6 WELLS FARGO |
1,440,229 |
442,276 |
2,088 |
|
| 7 BANK OF NEW |
1,058,618 |
348,624 |
2,052 |
|
| 8 STATE STREET |
904,593 |
17,888 |
238 |
|
| 9 PNC BANK NATIONAL |
248,705 |
135,477 |
5,793 |
|
| 10 SUNTRUST BAN |
241,369 |
124,495 |
2,158 |
|
| 11 MELLON BANK |
192,105 |
28,737 |
0 |
|
| 12 NORTHERN TRUST |
164,605 |
10,359 |
264 |
|
| 13 NATIONAL CITY |
158,612 |
36,975 |
2,250 |
|
| 14 KEYBANK NATIONAL |
134,344 |
81,744 |
8,594 |
|
| 15 U S BANK NATIONAL |
99,610 |
49,122 |
1,656 |
|
| 16 REGIONS BAN |
69,741 |
52,491 |
222 |
|
| 17 BRANCH BANK&TRUST |
61,752 |
36,578 |
348 |
|
| 18 FIFTH THIRD |
55,993 |
36,093 |
255 |
|
| 19 RBS CITIZENS |
54,602 |
49,074 |
252 |
|
| 20 MERRILL LYNCH |
46,761 |
24,000 |
9,248 |
|
| 21 FIRST TENNESSEE |
37,901 |
12,956 |
0 |
|
| 22 LASALLE BANK |
36,884 |
24,320 |
2,269 |
|
| 23 UNION BANK |
32,063 |
17,546 |
0 |
|
| 24 UBS BANK USA |
31,177 |
31,177 |
0 |
|
| 25 DEUTSCHE BANK |
30,693 |
24,348 |
4,578 |
|
| TOP 25 COMMERCIAL BANKS & TCs WITH DERIVATIVES |
$179,893,240 |
$24,815,180 |
$16,408,589 |
|
| OTHER COMMERCIAL BANKS & TCs WITH DERIVATIVES |
450,976 |
56,915 |
||
| TOTAL COMMERCIAL BANKS & TCs WITH DERIVATIVES |
180,344,216 |
24,872,094 |
Source: OCC |
Table 1 – Breakdown of derivative holdings in the top 25 U.S. banks showing that JP Morgan has the lion’s share of the counter-party derivative risk.
In comparison, the next in line with derivative risk is Bank of America (BAC) with a total just shy of $40 trillion including slightly more than $3 trillion in credit derivative risk. Next is Citibank (C) with less overall derivative exposure but greater credit derivative risk.
This is the truly frightening part. As a group, the top 5 U.S. banks have total derivative liabilities of more than $174 trillion with $16 trillion in credit derivative risk. Is it any wonder that investors in the know have been running scared?

Figure 4 – Think with the credit meltdown that derivatives have been falling? Think again. As of the most recent data, the size of the Over-the-Counter (OTC) derivatives markets has continued to grow hitting nearly $600 trillion in December 2007 according to the Bank of International Settlements that tracks the data globally. This is a doubling rate of less than 2 years. As a point of comparison, trading volume on the Nasdaq doubled every 4.1 years from 1990 to 2000 and was doubling every 2.07 years in the wild parabolic increase from 1998-2000 and look what happened afterward. A doubling rate of 1.88 years was clearly unsustainable!
Can Bailouts Work?
As of the $700 billion bailout on October 3, 2008, the federal government and Federal Reserve are on the hook for more than $2 trillion dollars in bailouts, guarantees and similar debt programs. (See article, “Cost of U.S. Crisis Action Grows, Along With Debt” below.) Many in government and capital markets are hoping that much of this money will not be needed and that the taxpayer may actually profit in the final analysis. But what happens if the flip-side is true and it’s not enough to deal with the problems?
As we see from the next figure, debt at all levels from private to government have been steadily climbing, especially in the last two decades. As of the first quarter 2008, U.S. debt was nearly 350% of GDP but that’s not the scary part. According to some credible analysts like Ian McAvity, the true figure is actually 360% of GDP.

Figure 5 – Undoubtedly the most important chart in our indicator library currently as governments, especially here in the U.S., spends like there is no tomorrow. And judging by the lack of interest over the last six months in U.S. Treasuries from abroad, there may not be. I find it interesting that the financial media has not picked up on this. Treasury income flows were minus $400 million in August (more Treasuries were sold than purchased) down from the net redemption of $33.6 billion (revised) in July. But as we see from the orange trendline, this trend has been falling over the last three years.
The important takeaway is that Treasury must sell an average of a minimum of $33 billion (yellow dashed horizontal line) every month just to pay the bills – assuming the final 2008 budget deficit is $400 billion. In all likelihood it will be substantially higher especially given the more than $2.2 trillion in bailouts this year so far. Now imagine what would happen if the budget deficit soars above $1 trillion in 2009 (a very conservative estimate) which would push the federal government’s monthly requirement for cash up to more than $80 billion! Now imagine what this would do to real interest rates as Treasury was forced to increase the return in pays to attract enough foreign investors in a deteriorating economy!
Look what happened the last time we had a really serious slowdown in the early 1930s (Figure 6). GDP fell by 45% pushing the ratio Debt/GDP from 155% in 1929 to 260% by 1932 as the economy worsened – a 67% increase in just three years. A similar economic meltdown again, which is now looking increasingly possible, would push our total debt to GDP ratio to nearly 600%! What investor, foreign or domestic would finance a borrower with this level of debt burden? One only has to look at what is happening Iceland to get a taste of what to expect (see article below).
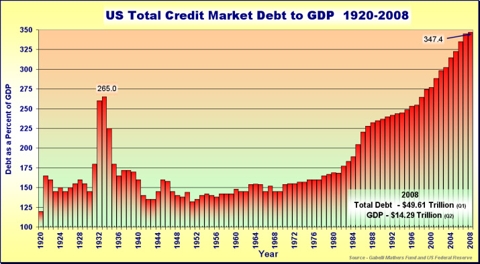
Figure 6 – Total credit market debt to GDP percentage rises to nearly 350% in Q1-2008. This rate of debt increase is clearly unsustainable but more alarming is what will happen when we have a significant economic slowdown.
Given the scenario above, how does the government pay the bills if the majority of bailouts are required? As of the latest U.S. Treasury income flow figures, net Treasury sales have fallen below the $33 billion per month needed just to pay the current government deficit of approximately $400 billion this year (see Figure 5). As the figure shows, net Treasury income flows (flow of money into and out of U.S. Treasuries) have shown a disturbing decline over the last two years.
Now imagine what would happen if the budget deficit doubles, triples or quadruples next year as the bailouts are needed? If the $2 trillion in bailouts currently committed is needed in 2009 or 2010 (and assuming no more bailouts are issued between now and then which is highly unlikely), the U.S. budget deficit would soar to $2.4 trillion. That translates to $200 billion in Treasuries every month that would need to be sold just to pay the bills on Capital Hill! Where is this money going to come from and what interest rate will Treasury have to pay?
Unless foreigners do an about-face and start buying Treasuries in record numbers, interest rates could be pushed dramatically higher as the government is forced to attract more money from abroad.
As Figure 6 demonstrates, it is unrealistic to expect the corporate or private sector to provide much help. Household debt is now at levels no seen before in history and corporate debt is being negatively impact by the derivative meltdown.
Living History – More questions than answers
In summary, we know from the Lehman auction that $400 billion in CDSs are worth less than 9 cents on the dollar. What about the other $54 trillion in CDSs? No government, central bank, or group of governments and central banks have the resources to pick up the tab if there is a significant mark-down in the value of these assets. And CDSs are only 10% of the total OTC derivative market. Will other derivatives risk a similar fate? It is a potential scenario that could make the Great Depression and 20-year Japanese collapse look like practice runs.
We are living through one of those rare periods in history in which theory and practice collide. In theory, capitalist systems should be self correcting. But at no time in history have we experienced so many bubbles at one time with the mother of them all driven by the unprecedented creation of new sources of money through unregulated derivatives. No one knows how bad it will get, what damage will ultimately be done to our economic fabric and how long it will take to repair it.
Talking heads in the financial industry and media are again telling us we are at a bottom. But it is important to remember that these so called “experts” have a lousy track record of getting you out of the markets in times of trouble. This became painfully evident when The Economistpolled economists in March 2001 as to whether they though the U.S. would enter recession. A full 95% said no. But as we later learned, we were already in recession at the time! Are they are reinforcing that legacy once again?
We will never know how bad a situation will get till the risks have passed. It is at times like these when following the sage advice of Will Rogers is not a bad way to go.
“I’m more concerned about the return of my capital than the return on my capital.”
Capital Hill politicians deal with the heat. C. Beeler, published with permission
From March 2008 Report by the Office of the Comptroller of Currency
Commercial bank derivatives activity is heavily concentrated in the three largest dealers, which hold 92% of all contracts. The five largest dealers hold 97% of all contracts and the largest 25 banks with derivatives activity account for nearly 100% of all contracts.
A total of 1,003 insured U.S. commercial banks reported derivatives activities at the end of the first quarter, an increase of 48 banks from the prior quarter.
The notional amount of derivatives contracts held by U. S. commercial banks in the first quarter increased by $14.7 trillion, or 9%, to $180.3 trillion. Derivative notionals are 25% higher than a year ago. The first quarter increase follows an unusual fourth quarter 2007 decline in notionals due to declines in interest rate notionals. In the first quarter, however, interest rate contracts advanced 9%, or $13 trillion, as higher levels of interest rate volatility resulted in greater client flows and proprietary trading activity.
Glossary of Terms
Derivative: A financial contract whose value is derived from the performance of underlying market factors, such as interest rates, currency exchange rates, and commodity/equity prices. Derivative transactions include a wide assortment of financial contracts including structured debt obligations and deposits, swaps, futures, options, caps, floors, collars, forwards and various combinations thereof.
Credit Derivative: A financial contract that explicitly shifts credit risk from one party to another. Instruments include over-the-counter (OTC) credit derivatives, such as credit default swaps, total return swaps, and credit spread options.
Currency Derivative: It is a derivative contract in which one party pays a periodic fee to another party in return for compensation for default (or similar credit event) by a reference entity. It is not necessary for the protection buyer to suffer an actual loss to be eligible for compensation if a credit event occurs.
Credit Derivative Swap: A financial instrument the value of which is derived from the creditworthiness of an underlying asset, portfolio of assets or issuer. It is a derivative contract in which one party pays a periodic fee to another party in return for compensation for default by areference entity. It is not necessary for the protection buyer to suffer an actual loss to be eligible for compensation if a credit event occurs.
Interest Rate Swap: An agreement to exchange interest rate cash flows at specified intervals during the life of the agreement. Each party’s payment obligation is computed using a different interest rate. In an interest rate swap, the notional principal is never exchanged. Although there are no standardized swaps, a plain vanilla swap typically refers to a generic interest rate swap in which one party pays a fixed rate and one party pays a floating rate (usually Libor).
Interest Rate Option: In an interest rate option, the underlying asset is related to the change in an interest rate. In an interest rate cap, for example, the seller agrees to compensate the buyer for the amount by which an underlying short-term rate exceeds a specified rate on a series of dates during the life of the contract. In an interest rate floor, the seller agrees to compensate the buyer for a rate falling below the specified rate during the contract period. A collar is a combination of a long (short) cap and short (long) floor, struck at different rates. Finally, a swap option (swaption) gives the holder the right—but not the obligation—to enter an interest rate swap at an agreed upon fixed rate until or at some future date.
Sources – ISDA and OCC
Stock position: None.
Related articles
- Four London Based Cartel Banks In The U.S. Hold A Staggering 95.9% Of The U.S. Counterfeit Money aka; ‘Derivatives’: The $600 Trillion Counterfeit Time Bomb That’s Set To Explode! (politicalvelcraft.org)
- How To Crash J.P. Morgan Who Is Trying To Crash The U.S. ~ Why? So They Can Hide Their Counterfeit Money aka; ‘Derivative Paper Debt’ (politicalvelcraft.org)
- Weekend Reflections: Million Babies March Onto Washington: Demanding The Nullification Of Banker’s Bailout! (politicalvelcraft.org)
- Banksters Within The United States: William Black Before Congress Tells The Real Truth! ~ H.R. 1489 Will Nullify The Banker’s Bailout And Return Our Money To Us. (politicalvelcraft.org)
- U.S. Foreclosures Back With A Vengeance: Remember, Make Them Prove The Mortgage Was Not A Derivative Debt ~ Banks Loose Key ‘Derivative’ Foreclosure Ruling In Top Massachusetts Court. (politicalvelcraft.org)
- Re-Elect Obama, What The Hell?: Only Thing Remains Is To Shoot Us Between The Eyes ~ But Hold On, Are Treason Charges Forthcoming? (politicalvelcraft.org)

