

NEW YORK (CNNMoney) — The August jobs report was dismal for plenty of reasons, but perhaps most striking was the picture it painted of racial inequality in the job market.
Black unemployment surged to 16.7% in August, its highest level since 1984, while the unemployment rate for whites fell slightly to 8%, the Labor Department reported.
United States Population
White 79.96%, black 12.85%, Asian 4.43%, Amerindian and Alaska native 0.97%, native Hawaiian and other Pacific islander 0.18%, two or more races 1.61%
note: a separate listing for Hispanic is not included because the US Census Bureau considers Hispanic to mean persons of Spanish/Hispanic/Latino origin including those of Mexican, Cuban, Puerto Rican, Dominican Republic, Spanish, and Central or South American origin living in the US who may be of any race or ethnic group (white, black, Asian, etc.); about 15.1% of the total US population is Hispanic.
“This month’s numbers continue to bear out that longstanding pattern that minorities have a much more challenging time getting jobs,” said Bill Rodgers, chief economist with the Heldrich Center for Workforce Development at Rutgers University.
Black unemployment has been roughly double that of whites since the government started tracking the figures in 1972.
Economists blame a variety of factors. The black workforce is younger than the white workforce, lower numbers of blacks get a college degree and many live in areas of the country that were harder hit by the recession — all things that could lead to a higher unemployment rate.
But even excluding those factors, blacks still are hit with higher joblessness.
Unemployment rate, state by state
“Even when you compare black and white workers, same age range, same education, you still see pretty significant gaps in unemployment rates,” said Algernon Austin, director of the Race, Ethnicity, and the Economy program at the Economic Policy Institute. “So I do think the fact of racial discrimination in the labor market continues to play a role.”
About 155,000 blacks got jobs in August, but the group’s unemployment rate still went up because those jobs weren’t enough to make up for all the people who started looking for work during the month.
Black Caucus A Main Player In U.S. Financial Disaster: Foreclosures Increase By 65% of MSAs In 3Q
However, the gain for whites of 211,000 jobs was enough to bring their unemployment rate down.
Overall, black men have it the worst, with joblessness at a staggeringly high 19.1%, compared to 14.5% for black women.
Black unemployment has now remained above 10% for four straight years, and the given current economic sluggishness, some experts say it’s safe to predict the rate will remain above 10% for four more years.
“Our job creation is just not happening — certainly not at the rate necessarily to bring rapid reductions to the unemployment rate,” Austin said.
Latinos saw their unemployment rate remain unchanged at 11.3% in August. Unemployment remains at 9.1% for the country as a whole.
Have you run out of unemployment benefits? How are you surviving? Send an email to realstories@cnnmoney.com and you could be profiled in an upcoming piece on CNNMoney. Please include your phone number. For the CNNMoney Comment Policy, click here.
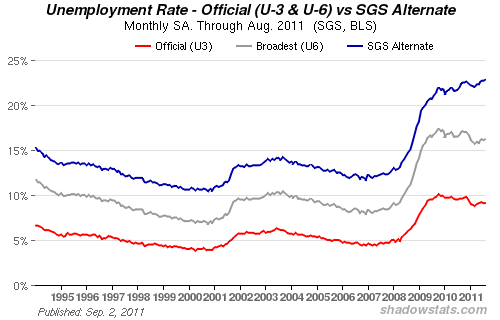
Smart money knows about this graph taken from an insiders news letter called Shadowstats. What’s happening above is a clear difference in direction between the official government numbers and reality.
The seasonally-adjusted SGS Alternate Unemployment Rate reflects current unemployment reporting methodology adjusted for SGS-estimated long-term discouraged workers, who were defined out of official existence in 1994. That estimate is added to the BLS estimate of U-6 unemployment, which includes short-term discouraged workers.
What’s the Real Unemployment Number?
Last week’s surprisinglysharp decline in the unemployment rate from 9.4% to 9%and equally surprising anemic job growth — 36,000 new jobs — left a lot of investors scratching their heads. How could the unemployment rate plummet so significantly while a such atrivial number of new jobs were created?If we simply extrapolate those numbers, we get some nonsensical results. If adding 36,000 jobs to the 139 million jobs in the U.S. economy lowers the unemployment rate by 0.4 percentage points, then adding just 720,000 jobs should lower the unemployment rate by 8 points — from 9% to only 1%.
Yet theBureau of Labor Statisticsdata shows that 812,000 jobs were added in the year from January 2010 to January 2011 (138,511,000 vs. 139,323,000). Based on the unemployment rate announced last week, we could expect that those 812,000 additional jobs would have lowered the unemployment rate to near-zero. But of course, we know they didn’t.

What gives?
The basic reason why the numbers don’t add up is that the BLS is constantly adjusting the variables of this basic equation:Number of people in the workforce (civilian labor force) – number of people with jobs (employed) = number of unemployed people.
The BLS tracks the “civilian noninstitutional population” — everyone not in the Armed Forces, school, prison, etc. — and the “civilian labor force.” The category “not in labor force” includes everyone else, including “discouraged workers” who want a job but who have stopped seeking one.
This ongoing adjustment of who gets counted as part of the labor force leads statisticians to lower the unemployment rate — even though the number of employed people has barely ticked up.
To understand this, let’s consider a labor force of 100 people, of which 20 are unemployed. The unemployment rate is 20%. But if 10 unemployed people drop out of the labor force, that reduces the total labor force to 90, and the number of unemployed to 10. As if by magic, the unemployment rate is now only 11%, even though the number of people with jobs remains unchanged.
This is the “magic” behind last week’s astonishing decline in the unemployment rate.
Using the BLS data, we can reconstruct exactly what has happened over the past few years of recession and mild recovery.
The U.S. gains about 2 million new residents every year from births and legal immigration. For instance, the civilian noninstitutional population rose from 236.5 million in October 2009 to 238.5 million in October 2010.

Given this substantial increase in population every year, we might reasonably expect the civilian labor force to expand proportionally, as students graduate and new immigrants enter the workforce.
Yet according to the BLS, the civilian labor force was 153.8 million in January 2008 and 153.2 million in January 2011 — a decline of 600,000 while the population increased by some 6 million. And the not-in-labor-force category expanded by 2 million from January 2010 to January 2011, from 83.4 million to 85.5 million.
How is this possible? When unemployed people stop looking for jobs at their local unemployment office, the government no longer counts them as unemployed. That’s how the number of unemployed can drop from 15 million in November 2010 to 13.8 million in January 2011, a decline of 1.2 million, even though the economy created only about 400,000 jobs in those three months.
Over a longer time period, the not-in-labor-force group rose from 78.8 million in January 2008 to 85.5 million in January 2011 — an increase of almost 7 million.
How do you drop the unemployment rate? Simple: remove 7 million people from the labor force.
The Real Unemployment Level Is. . .
If the labor force reflected the growth in population, then we might expect it to have increased by almost 2 million people a year. Rather than decline by 600,000 over three years, the labor force should have increased by 6 million to about 159 million.
If we take the number of unemployed as roughly 15 million (the BLS number from November 2010) and the true labor force as 160 million (out of anestimated total population of 310 million), then the true unemployment rate would be about 9.4% — right where it was before the recent adjustment to 9%.
Other government statistical adjustments make equally little sense. Analyst Mike “Mish” Shedlock hasrevealed the inconsistencies of the BLS “birth-death model,”which guesstimates the number of jobs created by small businesses being “born” and “dying.” Depending on what the “black box” issues every month (the BLS does not reveal its methodology), the government may report that the economy has created hundreds of thousands of new jobs — that are often revised away in estimates a few months later.
Job Growth Is Still Weak
For context, let’s look at some other employment numbers. According to the ADP National Employment Report, which I reported on forDailyFinancein late December, the economy lost about 9 million private sector jobs during the recession —about 7.75% of all private -sector jobs.
Rather than get bogged down in the legerdemain of the BLS unemployment, birth-death model and not-in-labor-force numbers, we can assess U.S. job growth just by looking exclusively at the number of jobs. Isn’t that the meaningful gauge we all seek?
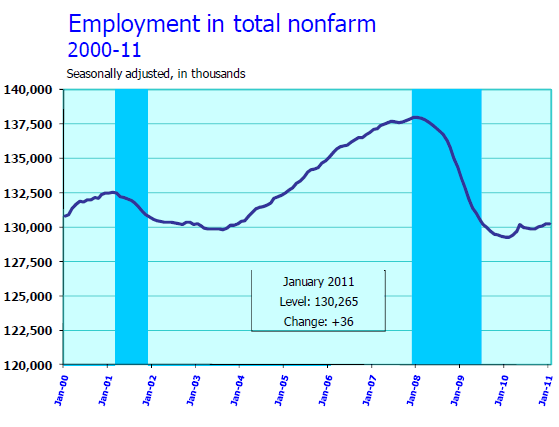
According to the BLS, the U.S. had 138.2 million jobs in October 2009, a few months after the official end of the recession. Sixteen months later, the country had 139.3 million jobs — a gain of 1.1 million. That’s a growth rate of about 880,000 new jobs a year. While that’s certainly encouraging, this rate of job growth lags far behind those of previous post-recession recoveries as this chart depicts.

Bottom line: The numbers that matter in the U.S. economy are the total number of jobs and the number of jobs created, not the constantly massaged unemployment rate and not-in-labor-force numbers.
Raising Of The Debt Ceiling Is Meaningless, In Comparison To The Banker’s Gambling Debt Bailout, That Spiraled From $700 Billion To $12.8 Trillion Behind Closed Doors.
The Debt Ceiling Was Raised 117 Times Since The $700 Billion Bailout.

According to a team at Bloomberg News, at one point last year the U.S. had lent, spent or guaranteed as much as $12.8 trillion to rescue the economy.
According to a team at Bloomberg News, at one point last year the U.S. had lent, spent or guaranteed as much as $12.8 trillion to rescue the economy. The Bloomberg reporters have been following that money. Alison Stewart spoke with one, Bob Ivry, to talk about the true cost to the taxpayer of the Wall Street bailout.
- AFL-CIO Chief Issues Warning to Democrats, George Soros: U.S. Largest Labor Union “AFL-CIO” Mobilizes With The International Association Of Machinists Union, Voted To Support The Glass-Steagall Act & To Declare Independence From The Democrat Party!
- Obama Assures America’s Slavery To Rothschild’s Banking System: By Printing $110 Billion New USD Per Month And Injects It Into The Commodities Market.
- Bilderberger & NWO Crony Bill Gates: Ploy To Vaccinate Every Child On The Planet ~ While Obama Strips $2.2 Billion For Food Stamps ~ $100 Billion For Education Assistance & Cuts Energy Assistance By $3.3 Billion. Unemployment & Foreclosures Soar!
- Financial Crisis

- Head Of Obama’s Economic Advisory Board: Jeffrey Immelt Of G.E., Stabs The United States In The Back!
- Sorry Tommy Coburn: Obama & The Banking Cartel Already Cut Education Assistance By $100 Billion, Already Cut Food Stamps By $2.2 Billion, & Health Care By +$6.6 Billion.
- Muslim Brotherhood Granted ‘Direct Access’ To Taxpayer’s Stimulus Grants By Obama!

Obama To Use His Own Jobs Disaster To Push Slave Labor
The Labor Department’s employment report for August was a perfect reflection of President Obama: It was a zero.
Not for 65 years has the Bureau of Labor Statistics reported an exact zero jobs growth in a month; but in fact, the BLS had to fake and fight for that. It added a hefty 83,000 “virtual jobs” to the pot—those imaginary “new start-up jobs” that it assumes every month, and then always quietly subtracts again nearly a year later. And it revised the jobs figures for June and July downward, by a total of 61,000, creating a lower starting point for August. At this point, without those “virtual jobs,” total U.S. employment would have been reported dropping in four of the past six months. Weekly and hourly average wages both fell in August.
The economy is collapsing, and it takes a lot of work to elevate NerObama to a zero.
Now what Obama will do, is try to use this employment collapse report to push his slave-labor schemes, where unemployed workers are put to work to earn their unemployment benefits, in his speech next Thursday. Notably, AFL-CIO head Richard Trumka, who consented to stand next to Obama yesterday about extending the FAA funding and highway bills, later in the day opposed the White House slave-labor plan pre-emptively. Knowing that Obama wants to take national a work-for-benefits plan called “Georgia Works,” Trumka sent him a public letter: “I am writing to convey the AFL-CIO’s continuing and serious concerns about the existing Georgia Works program and any expansion of the Georgia Works model. I am also requesting that the Department investigate the Georgia Works program to determine whether it is in compliance with Federal law.”

