
Last night, when laying out Bank of America’s case on how much higher this “one final meltup” can push Wall Street, we observed a topic that has gained particular prevalence in recent weeks: following the latest snapback from its September lows, instead of comparisons to 2007, the latest fad is to compare equity index chart to those in late 1998, early 1999 in the aftermath of the LTCM bailout, and just before the dot com bubble took off in earnest.
- 20 Reasons To Remember Remember The Gold In November.
- Saudi Arabia Dumps United States ‘Petro-Dollar’ As Sole Oil Settlements.
As a reminder, this is what B-of-A said:
It could simply be 1998/99 all over again. After all, a “speculative blow-off” in asset prices is one logical conclusion to a world dominated by central bank liquidity, technological disruption & wealth inequality.
Back then, as could be the case today, a bull market & a US-led economic recovery was rudely interrupted by a crisis in Emerging Markets. The crisis threatened to hurt Main Street via Wall Street (the Nasdaq fell 33% between July-Oct 1998, when LTCM went under).
Policy makers panicked and monetary policy was eased (with hindsight unnecessarily). Fresh liquidity combined with apocalyptic investor sentiment very quickly morphed into a violent but narrow equity bull market/bubble in 1998/99, one which ultimately took valuations & interest rates sharply higher to levels that eventually caused a “pop”.
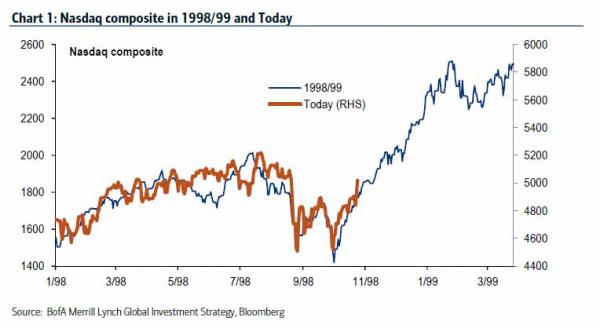
The most vivid example of why the blow-off top of 1998/1999 is now being cited as the potential scenario, is the following Nasdaq chart:
“The 1998-2015 analogy, for what it’s worth, is working for the Nasdaq, which is currently bouncing hard, and leading the rally, after an 18% plunge. (Although it is not yet working for biotech which is consolidating after a 35% crash”
Yet one place where the 1998/1999 analogy has so far failed to materialize, is crude oil. As BofA notes “despite the strong ECB & China policy action is conspicuously not rallying yet…in 1998-99 oil acted on the “first-in, last-out” principle, but eventually EM/global growth pushed oil much higher in 1999.”
Here is how the 1998/1999 overlay would look like for oil if it were indeed a “deja vu, all over again” situation.

The chart above needs no explanation: if this is indeed a rerun of the post-LTCM/pre first tech bubble days, then oil is about to soar by 150%.
But is it? BofA was skeptical.
New highs thus require:
- The Fed to hike, without…
- The dollar rallying significantly because…
- European/Japanese/Chinese domestic demand surprise on the upside.
That’s a tough ask.
Tough, but not impossible when your adversaries are entities that print money for a living.
BofA’s logic is contingent on no incremental news out of central banks; but recall that for China the biggest concern right now is neither reflating the housing bubble, nor boosting its stocks, but pushing the price of commodities higher since more than half of its levered commodity companies are unable to cover interest at current commodity prices, and will sooner or later force a default cascade.
Which is why anyone logically skeptical that oil and commodities can soar from here, for the simple reason that the latest gusher of central bank liquidity will merely result in more cheap funding and will lead to a production boost, leading to further price declines, should be careful: after all there is nothing in the (lack of) central banker rule book that says commodities are off limits for central banks to buy.
Related Articles:
- Trapped Central Banks Face Keynesian Endgame: “You Never Go Full-Krugman”
- Dow Jones Propaganda Average: Banking Cabal’s Algorithms vs The Capitulation.
- Buckle In My Friends For This Year’s “Debt Ceiling” Increase: Financial Markets Are No Longer Rising.
- US Mint Violating Congressional Law: Participating In Silver Price Suppression Of Capitalism’s Supply Demand For “Free Markets”
- B.P. Oil Spill & Deadly Corexit May Kill Millions Of U.S. Citizens: U.S. Strategic Petroleum Reserves Stored In Collapsing Salt Domes On Coast Of Louisiana!

