

Inflation Watch: Central Banks Just Printed the Equivalent of Germany’s GDP
The world’s Central Banks have finally succeeded in unleashing an inflationary storm.
The first pickup has only just begun to be felt. But this time next year, when inflation is well north of 4% globally and the big price moves have already occurred, everyone will be screaming “INFLATION!”
How did this happen?
Globally, Central Banks are now printing over $120 BILLION per month. And this is happening at a time when most major economies are out of harm’s way.
Put another way, the economies of the EU, Japan, and the US are all growing rather than contracting… but Central Banks are printing MORE money today than they were during the depths of the last systemic crisis (the EU crisis of 2012-2013).
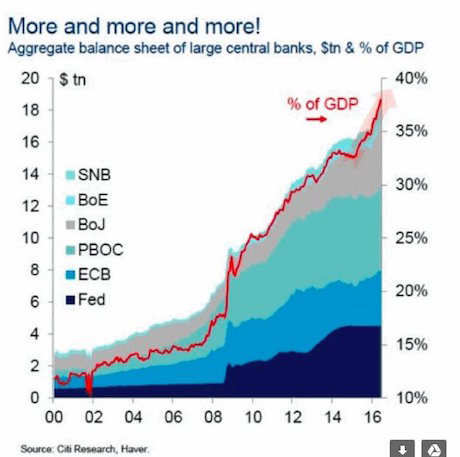
Moreover, Central Banks have been printing money at this pace (if not higher) for well nearly two years now. So we’re talking about nearly $1.5 TRILLION in “hot money” hitting the financial system annually for two years.
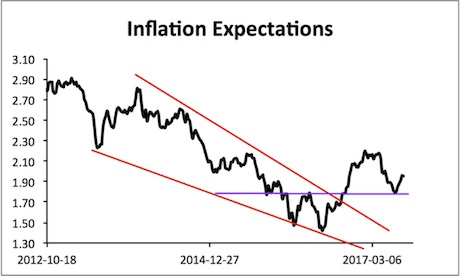
Put simply, Central Banks have printed the rough equivalent of Germany’s economy and funneled this money into the financial system in the last two years. And the markets have taken notice. Already inflation expectations are roaring higher having broken out of a long-term downtrend. European Central Bank Shooting Blanks: “Draghi Injects Monetary “Heroin” For Money Junkies”
The Biggest Stock Market Crashes Tend To Happen In October

The prospect of steep market declines worries investors – and the month of October has a particularly bad reputation in this respect.

A few things worth noting about 1987:
1. the crash did not presage a recession.
2. its extraordinary size was the result of a structural change in the market, as new technology, new trading methods and new hedging strategies were deployed.
3. Bernie (whoever he was/is) got six months.

Regarding point 2: in particular, the interplay between program trading and “portfolio insurance” proved deadly (the former describes computerized arbitrage between cash and futures markets, the latter was a hedging strategy very similar to delta-hedging of puts, which involved shorting of S&P futures with the aim of making large equity portfolios impervious to losses – an idea that turned out to be flawed).
Too many investors tried to obtain “insurance” by selling index futures at the same time, which pushed S&P futures to a vast discount vs. the spot market. This in turn triggered selling of stocks and concurrent buying of futures by program trading operations – which put more pressure on spot prices and in turn triggered more selling of futures for insurance purposes, and so on. The vicious spiral produced a one-day loss of 22.6% – today this would be equivalent to a DJIA decline of almost 5,000 points. Due to circuit breakers introduced after 1987, very big declines will lead to temporary trading halts nowadays (since 2013 the staggered threshold levels are declines of 7%, 13% and 20%; after 3:25 pm EST the market is allowed to misbehave as it sees fit). Interestingly, program trading curbs were scrapped again. We mention the case of 1987 because we believe today’s markets will eventually be faced with a “positive feedback loop” problem as well.
Many new trading strategies and products that have become popular during the Bernanke/Yellen echo bubble era have yet to be truly stress tested.
There are numerous new systematic strategies (almost all of which use leverage in some shape or form), there are now more listed ETFs and ETNs than listed stocks, high frequency trading is responsible for a very large share of trading volume, and open derivatives positions have grown extraordinarily large relative to trading volume in the underlying cash instruments.
Market volatility has all but disappeared over the past 18 months or so, but this is reminiscent of a pressure cooker. It seems highly likely that lot of “pent-up volatility” will eventually be unleashed (there is a very good reason to expect this to happen; extended periods of low volatility tend to go hand in hand with the gradual buildup of ever larger speculative positions which depend on its continuation; and this is usually accompanied by a steady increase in leverage with the aim of boosting returns.
As an aside, lately we quite often come across articles that explain why the market cannot go down, no matter what (here is a recent example that reminds us a bit of the “keiretsu argument of stock market invulnerability” that was popular in Japan in the late 1980s). [PT]

Although the month of October delivers an acceptable performance in seasonal terms if one disregards outliers like the crashes of 1987 and 2008, these particularly strong declines over such short time periods are nevertheless scary: what use is it to anyone if the market performs well in October several times in a row, but then generates such a large one-off loss that all previous gains evaporate? And what about intermittent losses?
Let as examine these extreme market moves more closely. The following chart shows the 20 largest one-day declines in the Dow Jones Industrial Average. Crashes that occurred in October are highlighted in red.
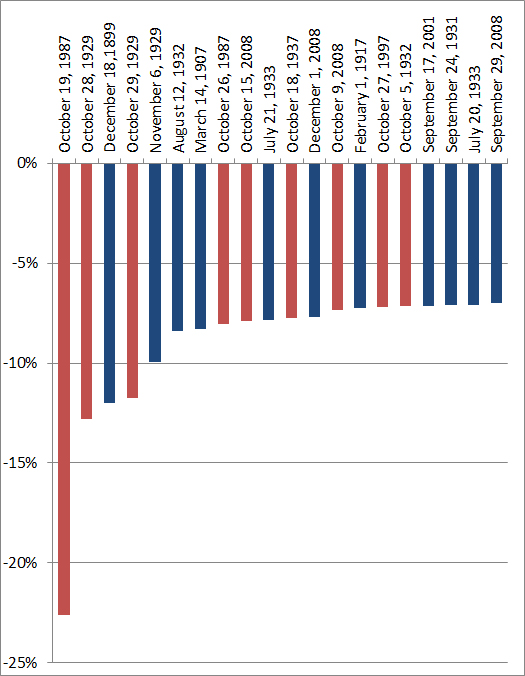
9 of the 20 strongest one-day declines occurred in October. That is an extremely disproportionate frequency. In other words, October has a strong tendency to deliver negative surprises to stock market investors – in the form of sudden crashes.
Outliers Are “Real”
Things look quite differently in the first half of the year. Only two of the 20 largest historical declines have taken place in these six months.
Investors must not allow themselves to be deceived. Such extreme price declines may be rare, but they exhibit seasonal tendencies as well. In most years it is more likely that gains rather than losses are generated, but as noted above, the losses frequently turn out to be exceptionally large.
October Moves Sideways on Average
October, it is actually not a particularly weak month on average. This is illustrated by the seasonal chart of the Dow Jones Industrial Average shown below, which encompassing a very long time period. Seasonal charts are different from standard charts; they don’t depict actual prices over a specific, definite time period.
Rather, they represent an average of many years of prices, which are shown in relation to the time of the year. The chart below illustrates the average price pattern of the DJIA calculated over a very long time span, namely the past 117 years. The horizontal axis depicts the time of the year, the vertical axis shows the price information (indexed to 100).

As the chart indicates, the statistically weakest month is actually September rather than October. In the course of October the market tends to move sideways on average. Net-net it even exhibits a small gain, albeit a well below average one.
Nevertheless, October delivers a better average performance than its reputation among stock market participants would suggest. Of course this reputation is not entirely undeserved, given that particularly large short term declines actually do very often occur in October.
Related News:
- Obama’s Pillars Of Paper Fantasy Dies: “Panic Will Ensue”
- South Korea Outlaws Cryptocurrencies Following China & Russia
- Senate Reports NARCO Bank HSBC Helped Deep State Drug Cartels Launder Money
- Hidden Cost Of ‘Too Big To Fail Bailout’ ~ Ballooned From $787 Billion To $12.8 Trillion.
- China “Gold Super Power” Urging Their Citizens To Diversify Into Physical Gold And Silver Since 2009

